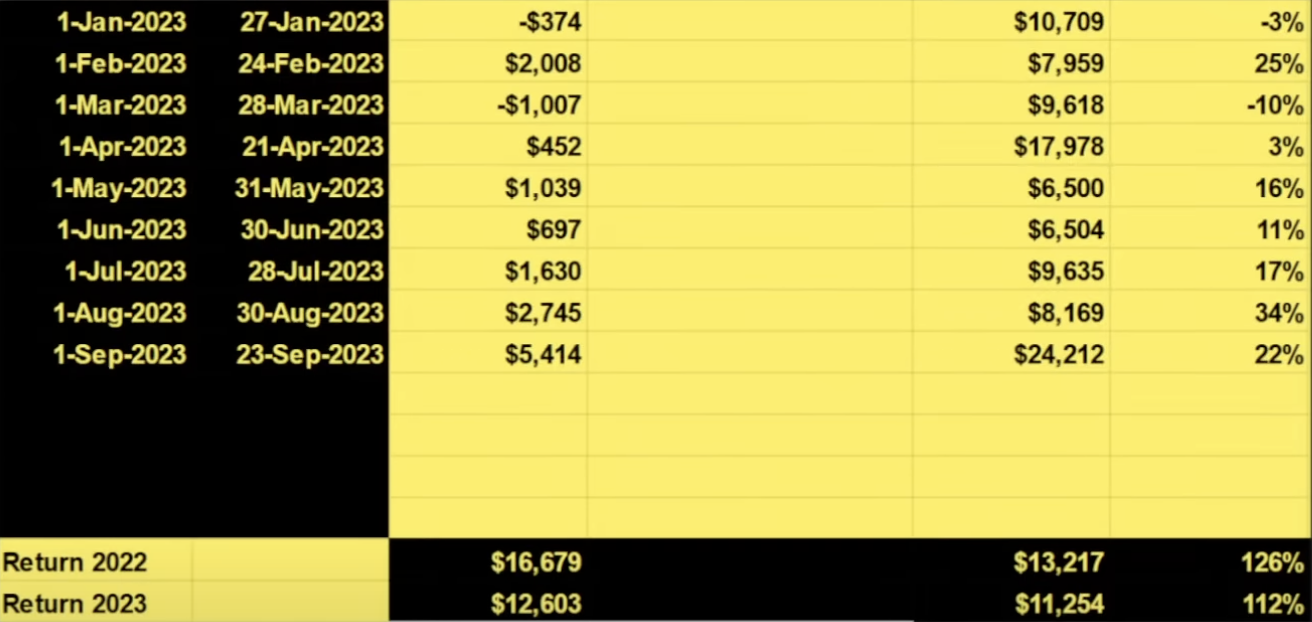
Trading gurus often boast about exceptional percentage gains to showcase their trading prowess. You may have heard them say, "I made 300% with this trade!" In financial terms, they are referring to their Return on Capital Employed (ROCE). It's essential for investors to understand the nuances of these metrics and how they can be misleading without proper context.
Let's delve into an example using NVIDIA Corporation (NVDA)..
Suppose a trading guru claims to have achieved a remarkable 300% ROCE by purchasing call options on NVDA.
Here's how the scenario unfolds:
1. Initial Investment and Trade Execution
The guru starts with a portfolio of $100,000 and decides to allocate $1,000 or 1% to purchase call options on NVDA.
2. Trade Outcome
The guru's $1,000 worth of call options on NVDA appreciate significantly and are now worth $4,000. The guru closes the trade.
3. Calculation of ROCE
ROCE = (final proceeds - initial investment) / initial investment
= ($4,000 - $1,000) / $1,000
= 300%
The guru proudly presents this 300% ROCE as evidence of his success.
4. Calculation of ROC
To calculate the Return On Capital (ROC), we need to consider the overall impact of this trade on the entire portfolio.
Final portfolio value = initial portfolio value + profit from the trade
= $100,000 + ($4,000 - $1,000)
= $103,000
ROC = ((final portfolio value - initial portfolio value) / initial portfolio value) * 100
= (($103,000 - $100,000) / $100,000) * 100
= 3%
The difference
While the 300% ROCE may seem impressive, the ROC of 3% tells a different story. Despite the exceptional ROCE, the impact of this trade on the overall portfolio is relatively modest when expressed as a percentage of the entire portfolio's value.
The misleading use of ROCE might extend beyond a single trade. As in the example below the guru might aggregate all their trades into a spreadsheet and claim a 100%+ return for the past year. However, once again, the return is calculated based on the employed capital for each trade and not on the total portfolio capital.

The benchmark comparison
What truly matters in evaluating investment performance is how it compares to benchmark indices like the S&P 500. Investors should aim to outperform these benchmarks over the long term, which can be better reflected by ROC rather than ROCE. While ROCE measures individual trade performance, ROC considers the overall impact on the portfolio, providing a more holistic view of investment success.
Key takeaways
- ROCE measures the return on capital employed in a specific trade, providing insight into the success of individual investments.
- ROC, or return on capital, considers the overall impact of a trade on the entire portfolio, reflecting its contribution to the portfolio's growth.
- Benchmark indices like the S&P 500 provide a standard for comparison, helping investors gauge their performance relative to the broader market.
Conclusion
Understanding the difference between ROCE and ROC is crucial for investors to avoid being misled by impressive-sounding but contextually limited metrics. While ROCE provides insights into individual trade performance, ROC offers a broader perspective on portfolio growth. Ultimately, the goal for investors is to outperform benchmark indices like the S&P 500, which can be better assessed through ROC rather than ROCE.

